
Vatech Case Study · Implant planning
3D CBCT comes in handy in a lot of different cases but implantology is undeniably one of the ones where it is useful the most. Since 3D CBCTs can noticeably improve your confidence in your implant preparation, we have decided to dedicate it a whole mini-series. We will cover the implant planning, with mandibular canal drawing, bone density qualification, and distance measurement, today. In the next article, you can look forward to reading about the process of choosing an implant and its placement into the 3D image.
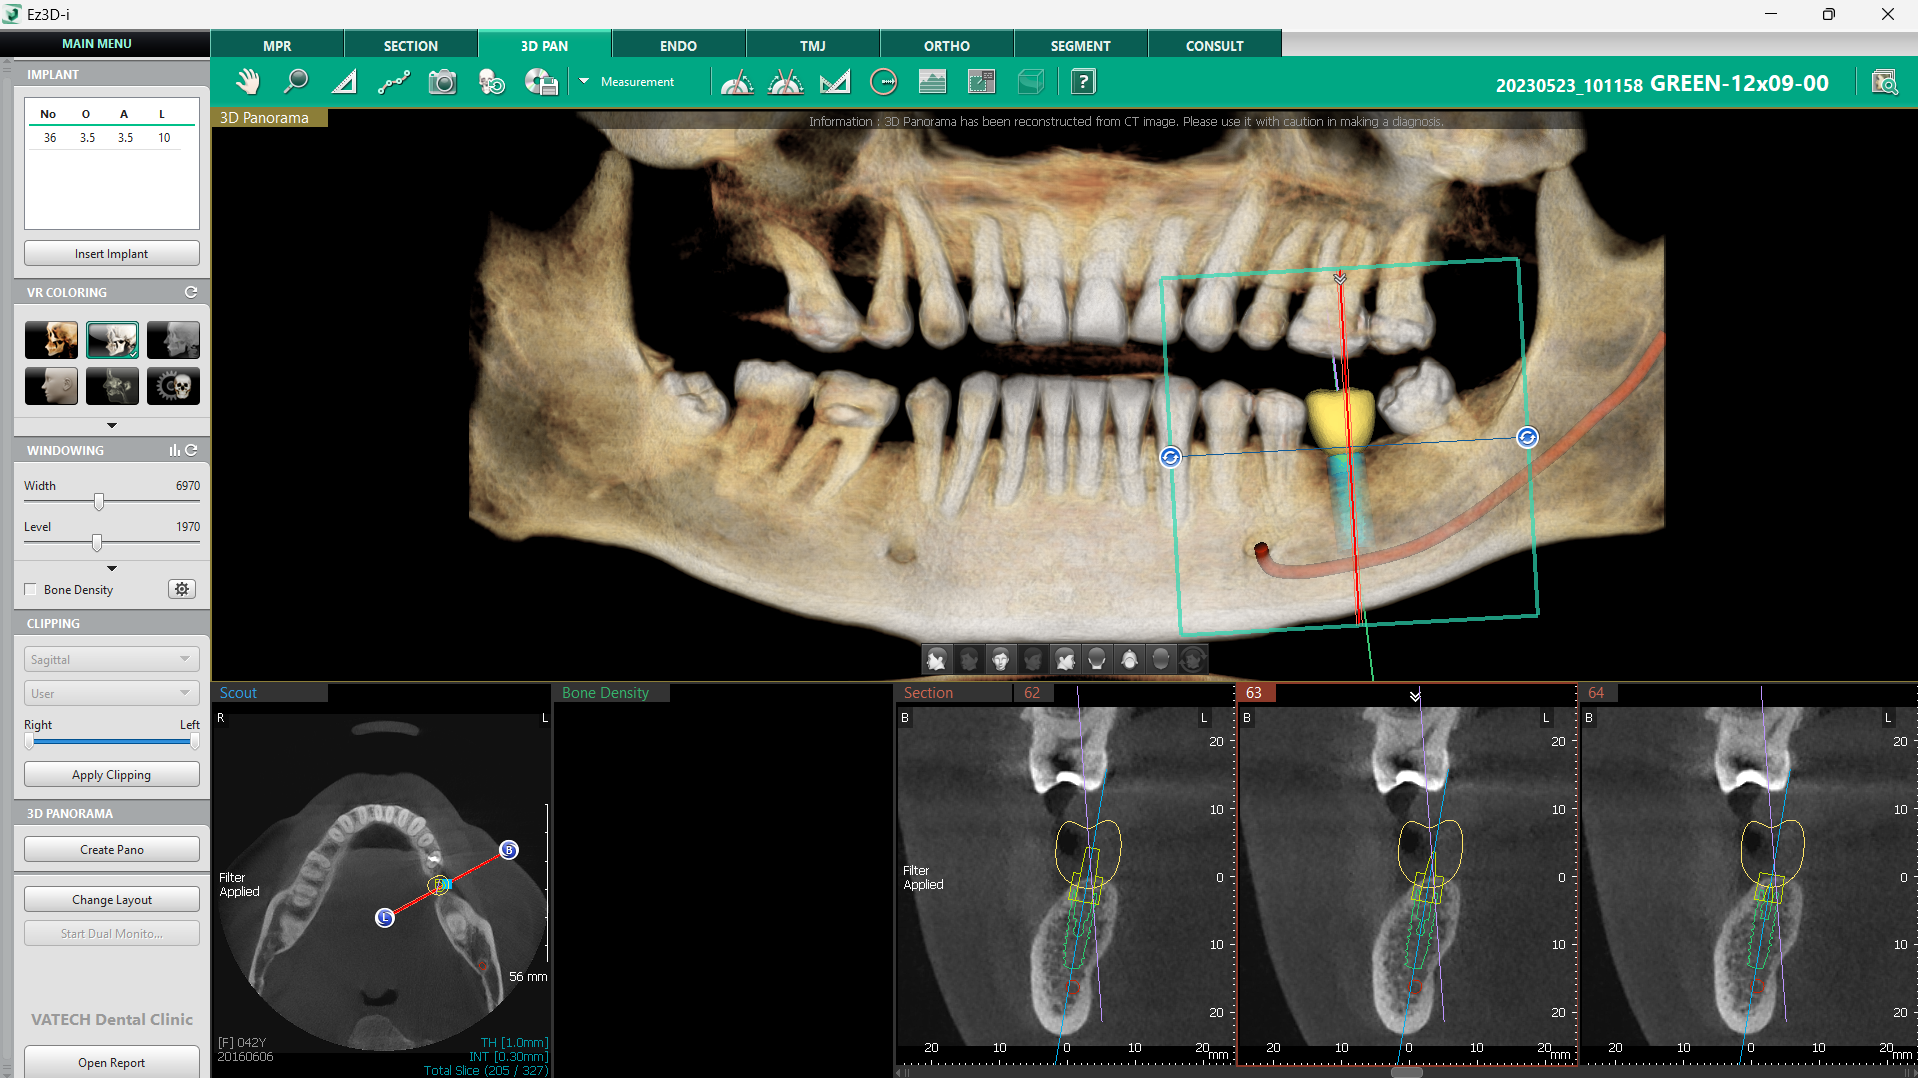
The patient needed an implant in place of tooth 36 and therefore, we will do an implant planning of that tooth in today’s article. We will mostly explore the “3D Pan” tab of our Vatech Software, Ez3D-i.
The key features that we will talk about today are:
1) 3D Navigator
2) 3D Panorama view
3) Drawing of the mandibular canal
4) Bone density qualification tools
- Bone density overlay
- Profile
- ROI
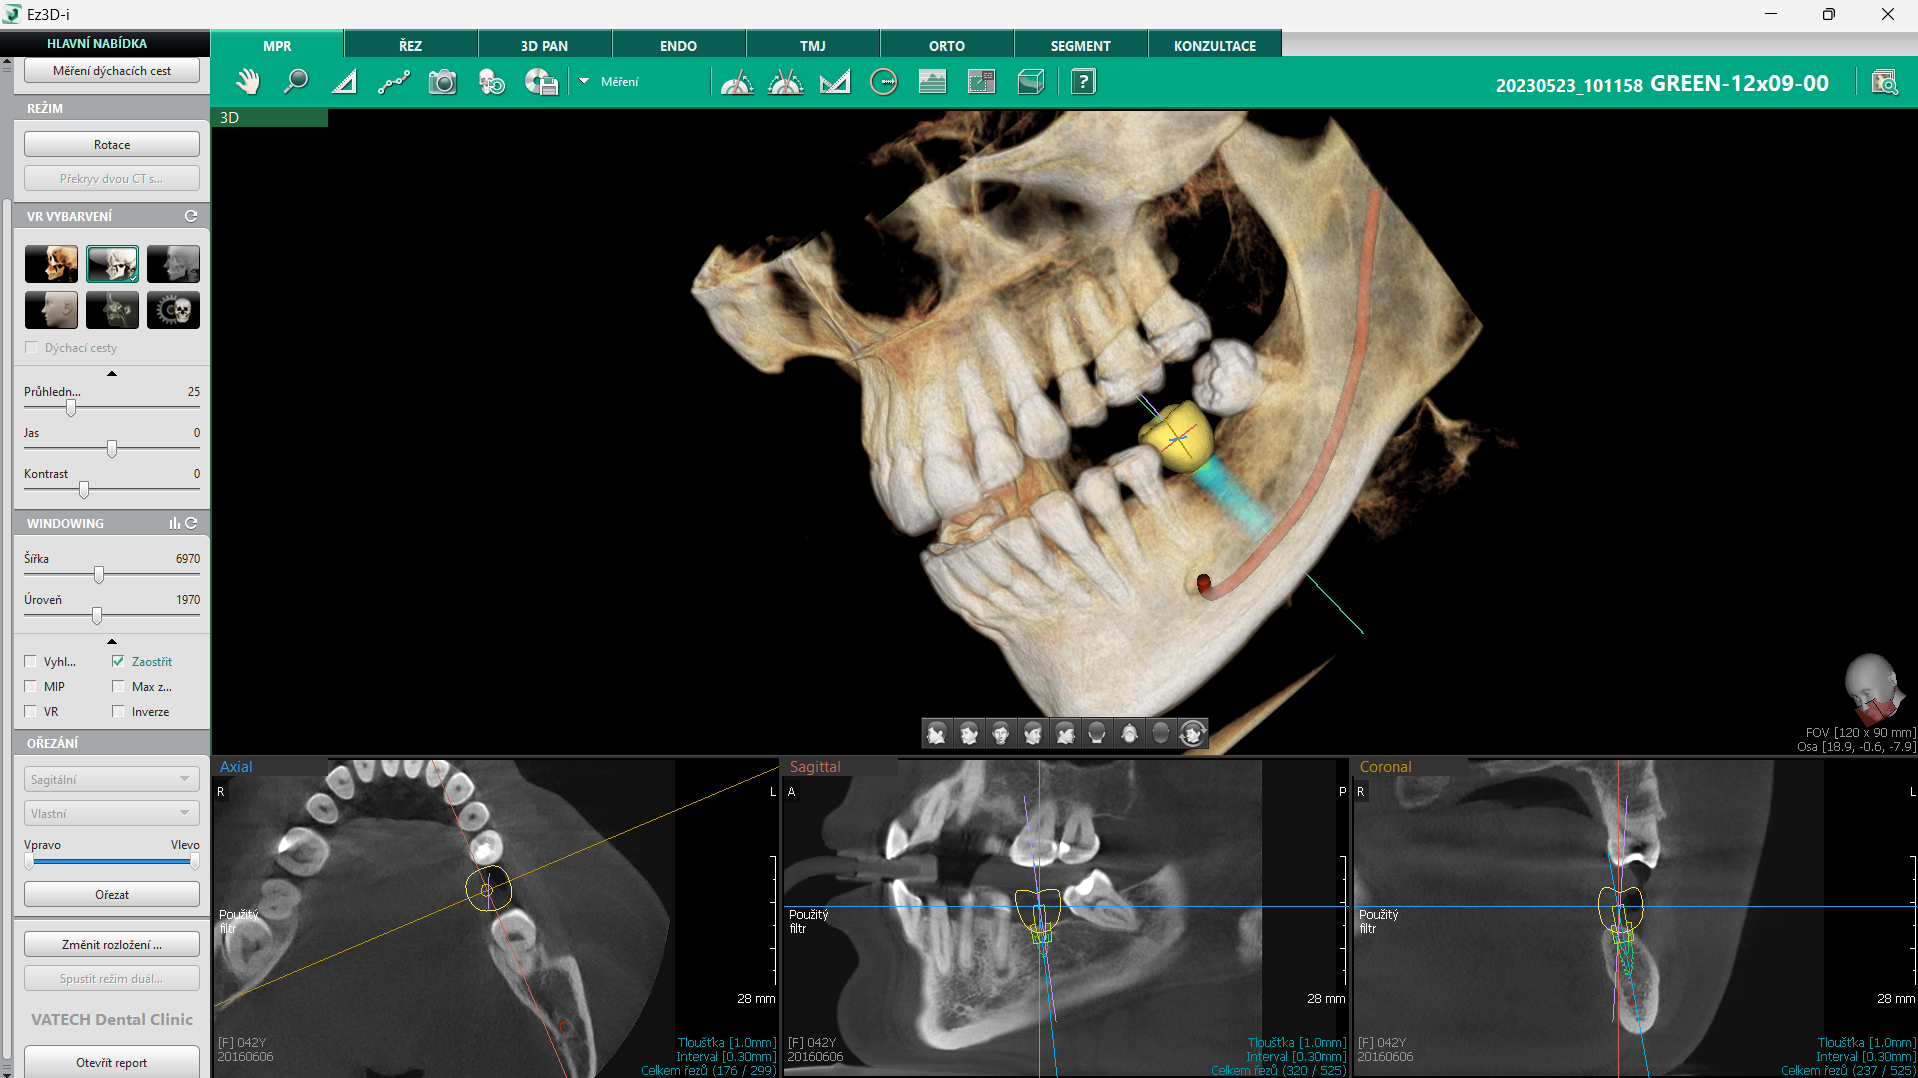
1) 3D Navigator
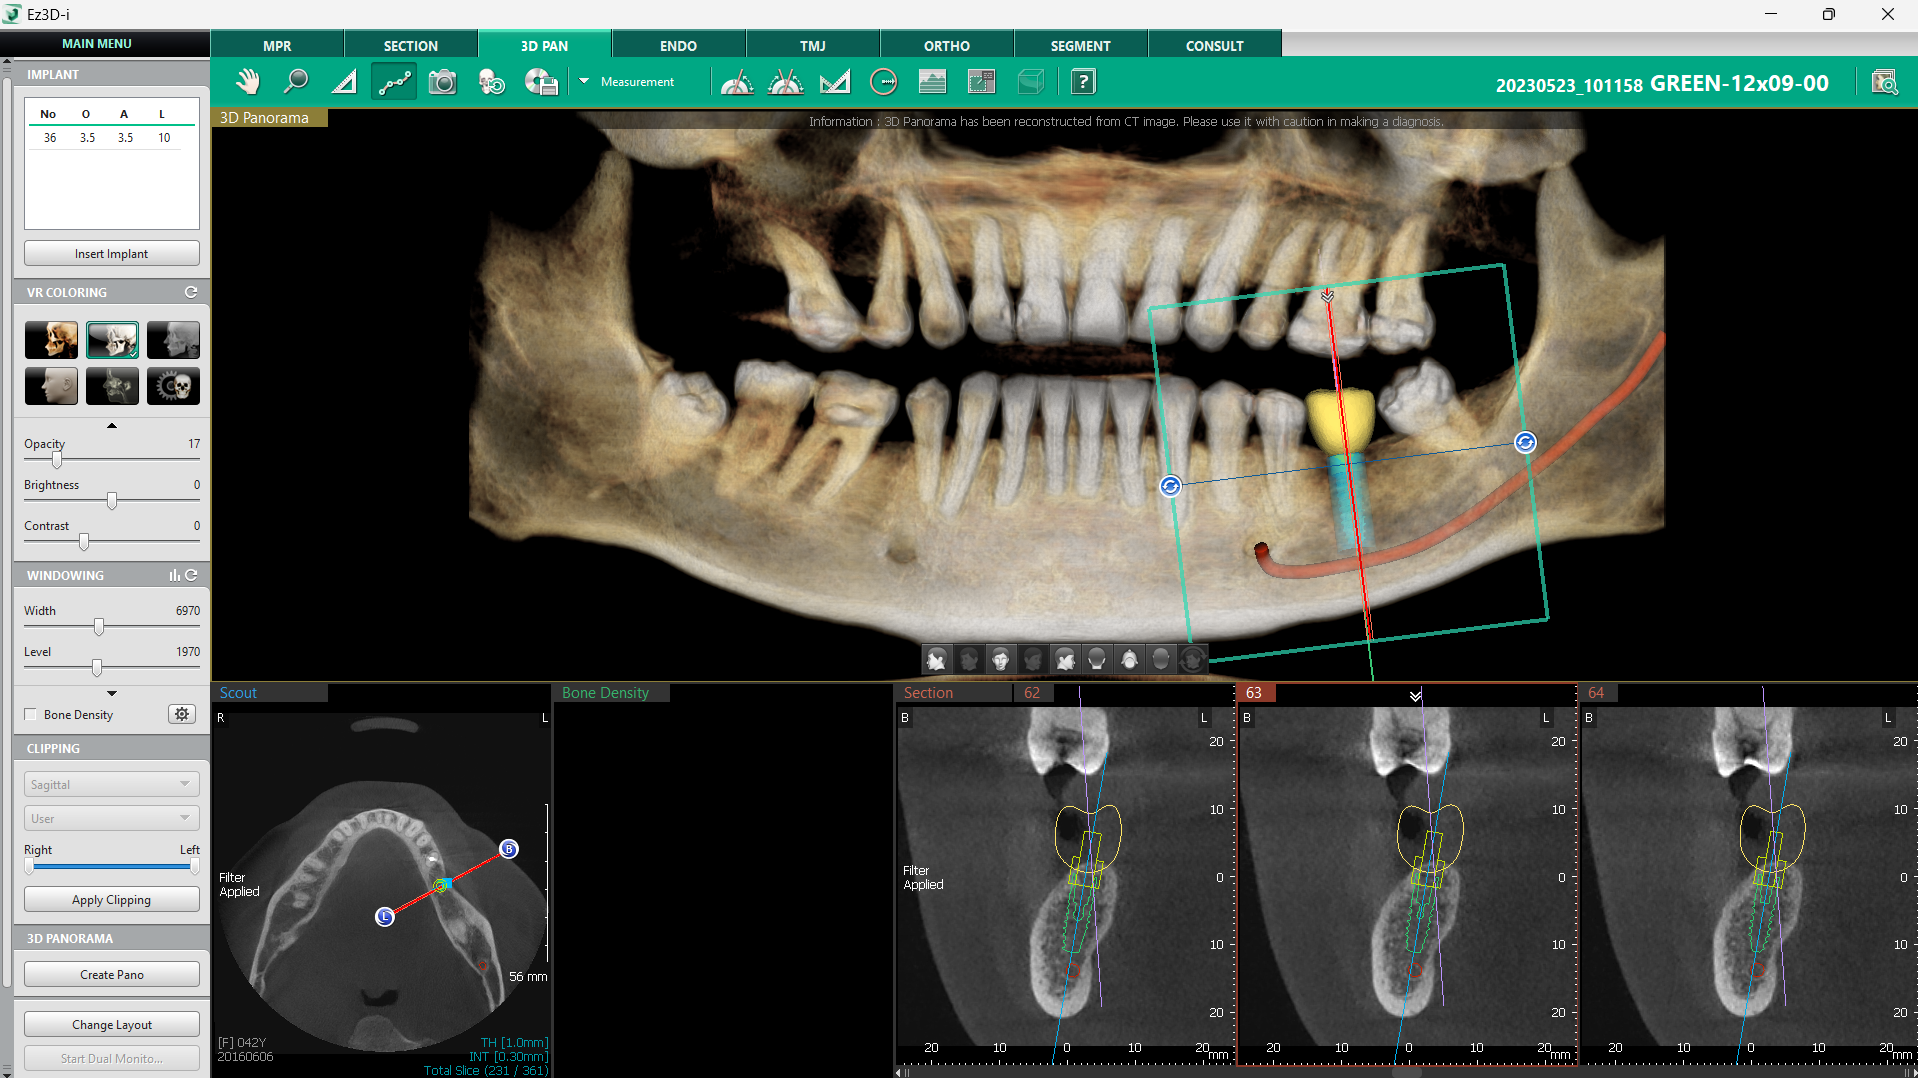
The main assistant in the 3D Pan tab, just like in some of the other tabs, is 3D Navigator. The function helps with navigation through sections displayed at the bottom part of the screen.
It is shaped like a green square with horizontal and vertical lines in the middle. The lines indicate the sections that we will see displayed. By clicking into the section images with your right mouse button and selecting “Interval”, you can determine the interval in between the displayed sections. This will be illustrated by the number and distance of red lines in your Navigator.
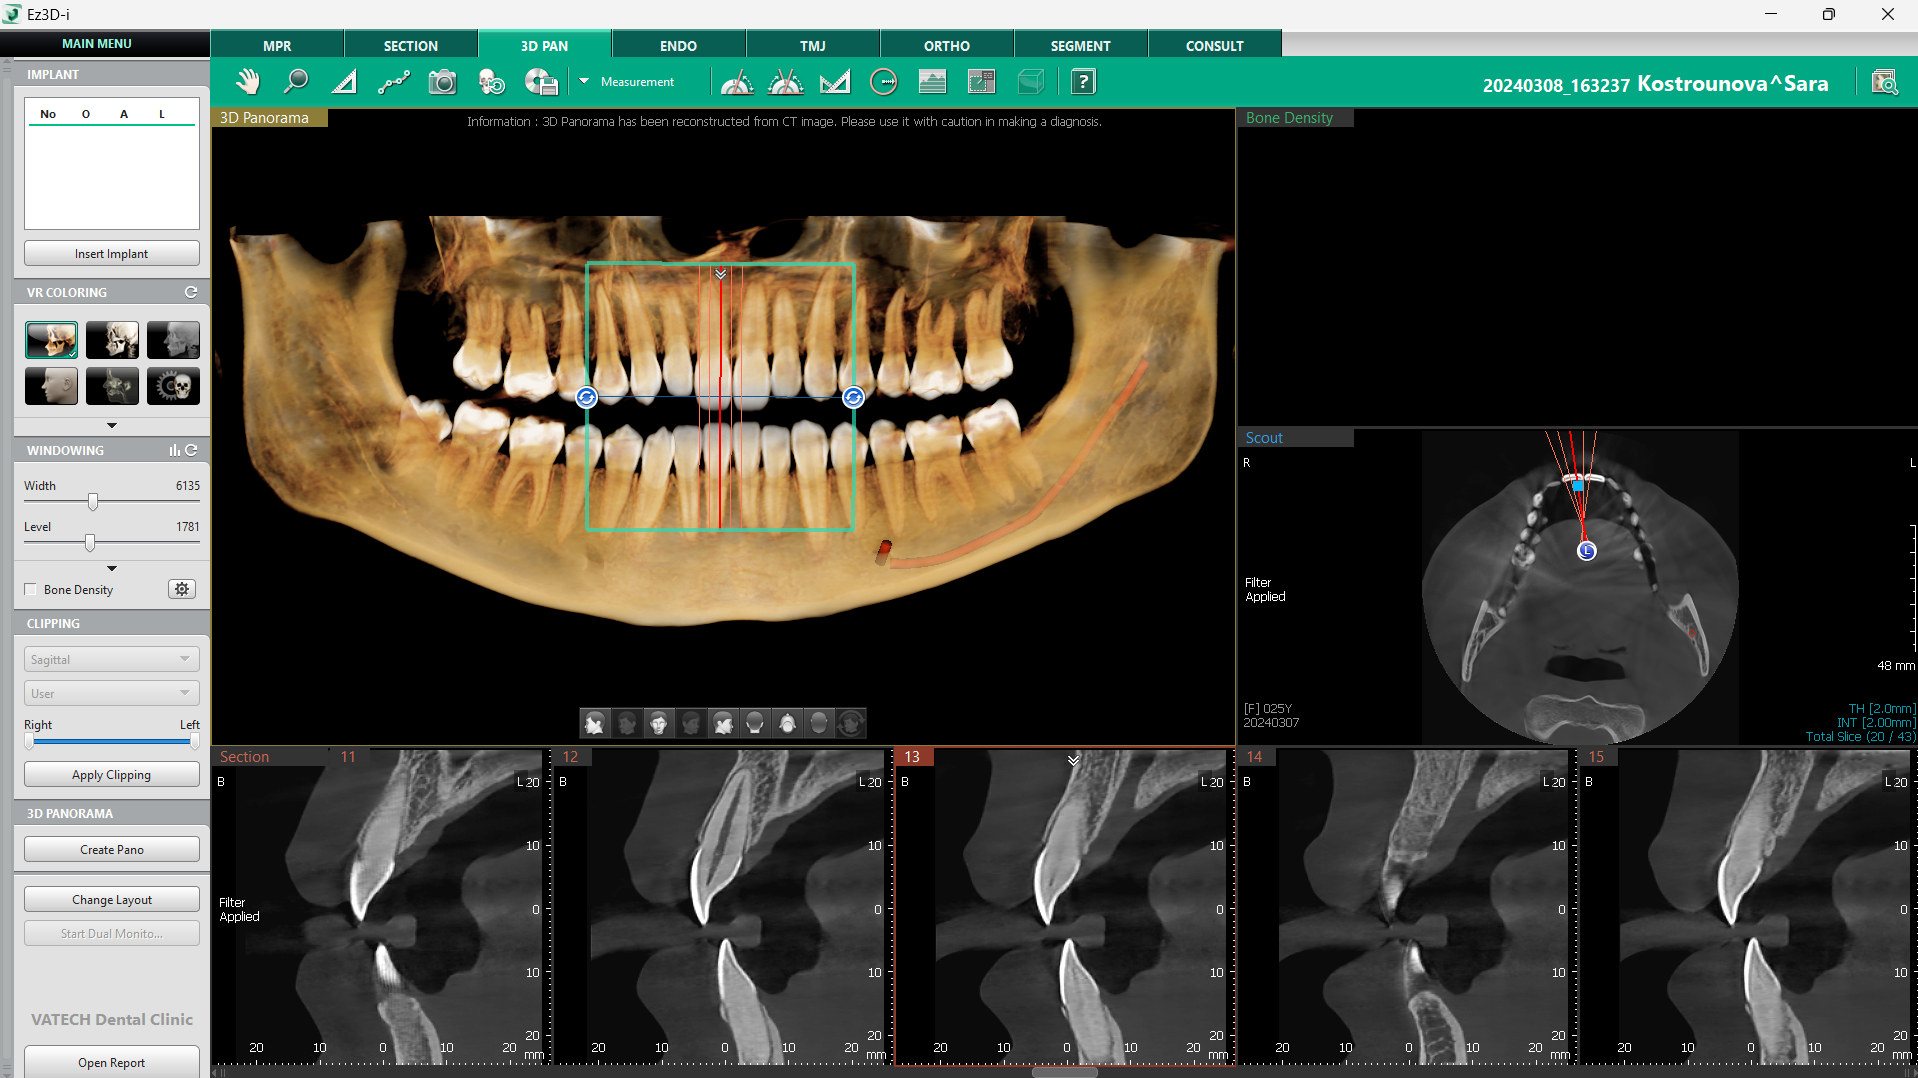
The 3D Navigator also has a rotation function which allows for a complete overview of the sections. It is quite easy and intuitive to use the function thanks to a couple of keyboard shortcuts. The return to the original position is quick and efficient with the double click function, which rotates the Navigator back to the starting point.
If you want to learn more about the 3D Navigator, you can check out our video dedicated to it HERE.
2) 3D Panorama view
3D Panorama view is the most distinctive feature in this tab. It is a special view that creates a Panoramic image out of a CT scan. This gives users unique diagnostic options, helps with navigation of the sections, and therefore, can be used as a strong diagnostic assistant. That is if the doctor keeps in mind its limitations resulting from the reconstruction process. It is a powerful tool in combination with the 3D Navigator, but it is not intended as a sole source of the diagnosis.
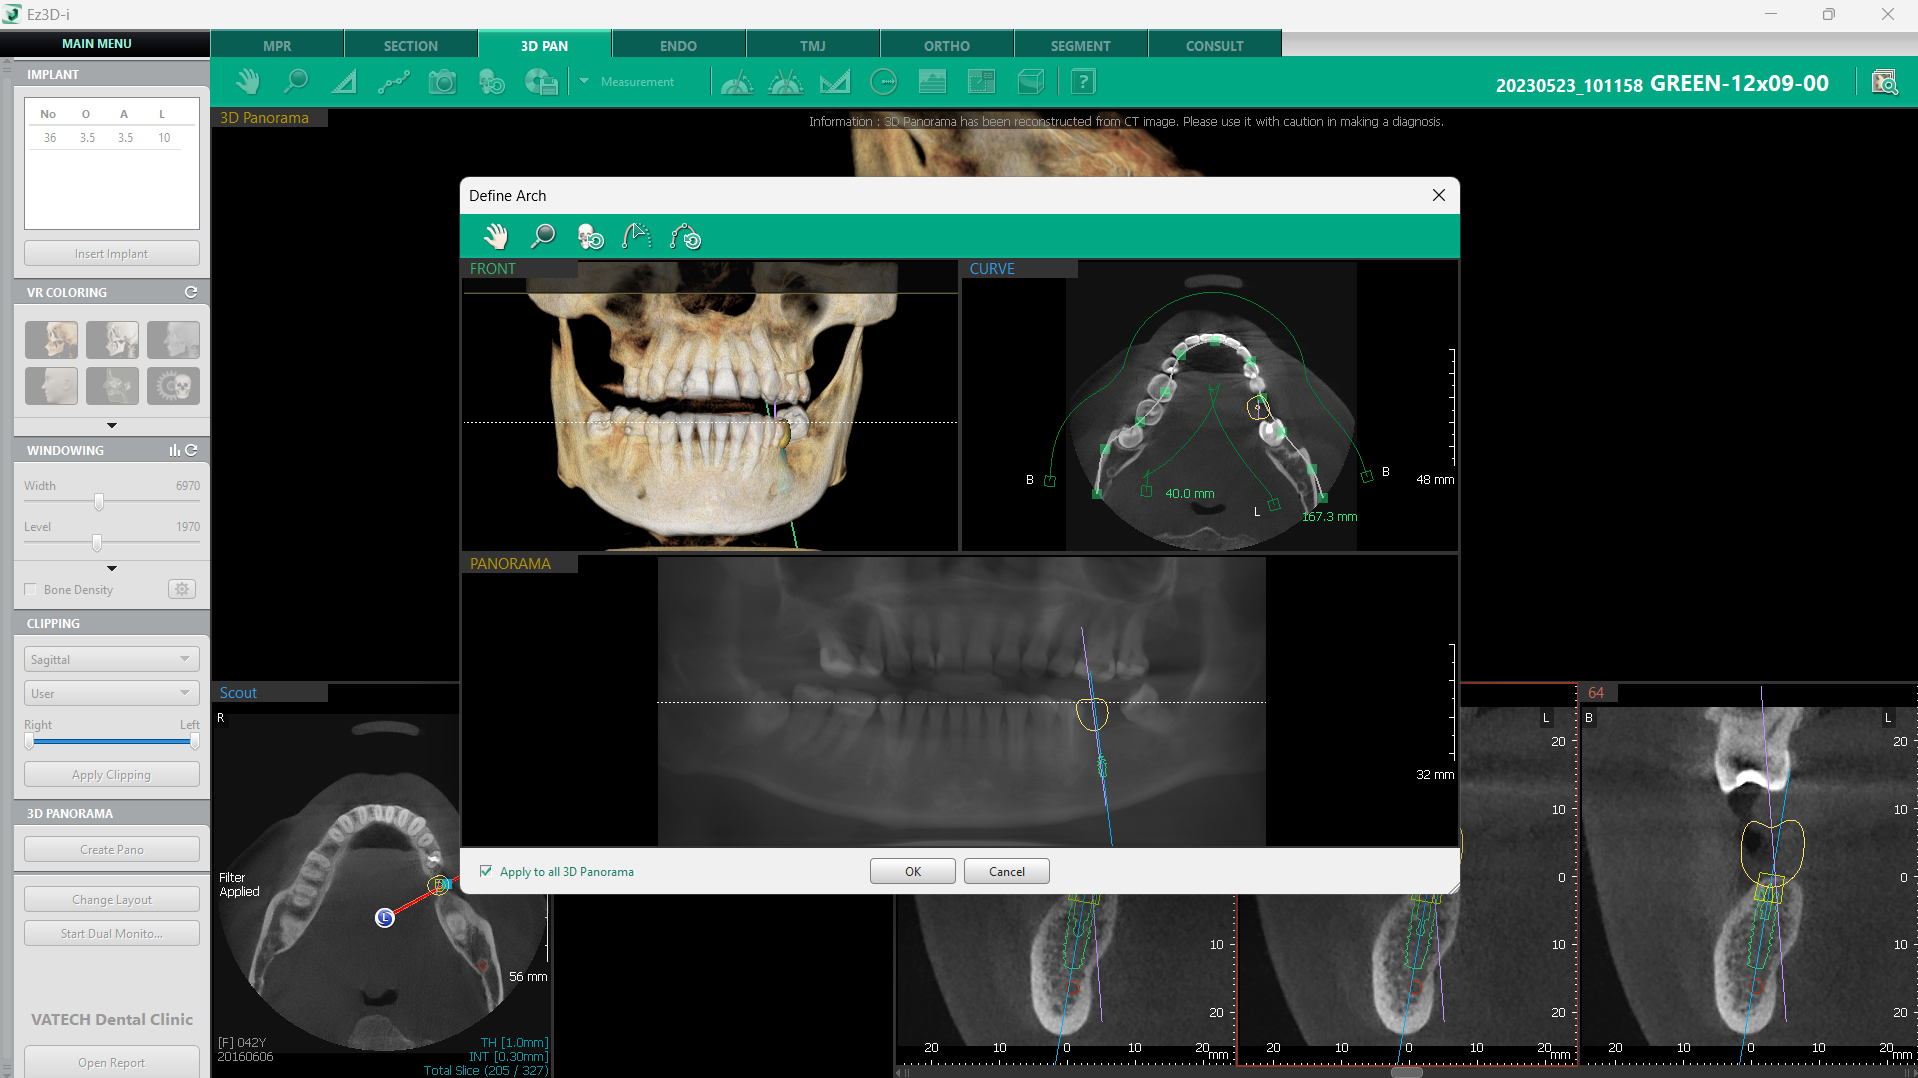
It is very easy to access this view. There is a “Change Layout” button at the lower left corner of the screen. There is a multitude of layouts featuring the 3D PAN feature with various number of displayed sections. There is also the option of showing the “Implant Bone Density” window perfect for implantology.
The 3D Panorama is also very customizable with the option to adjust the curve view. If you want to adjust your 3D PAN view, make sure you have selected a layout which has a 3D PAN window, and click on “Create Pano” in your lower left corner of the screen. A dialog window will appear and allow you to customize your 3D PAN view and perfect the final rendering image.
3D Panorama view is a dependable helper in implantology and other tasks in your everyday practice.
3) Drawing of the mandibular canal
Location of the mandibular canal can play a key role in deciding our approach to treatment in many cases. Ez3D-i has many options when it comes to the process of registering it in the 3D images. 3D PAN offers one of the easiest ways to do it efficiently and quickly. The combination of 3D Navigator and the 3D Panoramic image rendered from a CT scan offers a quick way of navigating the sections and finding the canal.
The process of drawing a mandibular canal starts with clicking on the “Draw canal” icon on the toolbar at the top of the screen. We would like to recommend starting the drawing at the foramen mentale, just like it was done in the YouTube video. The 3D Navigator will be a huge help in the process of finding the canal. It is very easy to use – after finding the canal, you can use the left mouse button to mark the canal and use the mouse wheel to move through the sections. In case of making a mistake, it is convenient to delete the previously plotted input point by clicking the right mouse button.
Once all the points are inputted, it is extremely easy to finish the canal line. All it takes is a double click.
In case of not needing the drawn canal anymore, right-click the line and select delete. Another option is to click edit and revise any possible inaccuracies.
More about the “Draw Canal” function can be found in a dedicated YouTube video on our channel HERE.
3) Bone density qualification tools
The inherent part of implantation is bone density quantification. Ez3D-i provides multiple tools which can help with determining the health of the bone and assist in the decision-making process before implantation.
We will talk about Profile, Bone density overlay, and ROI.
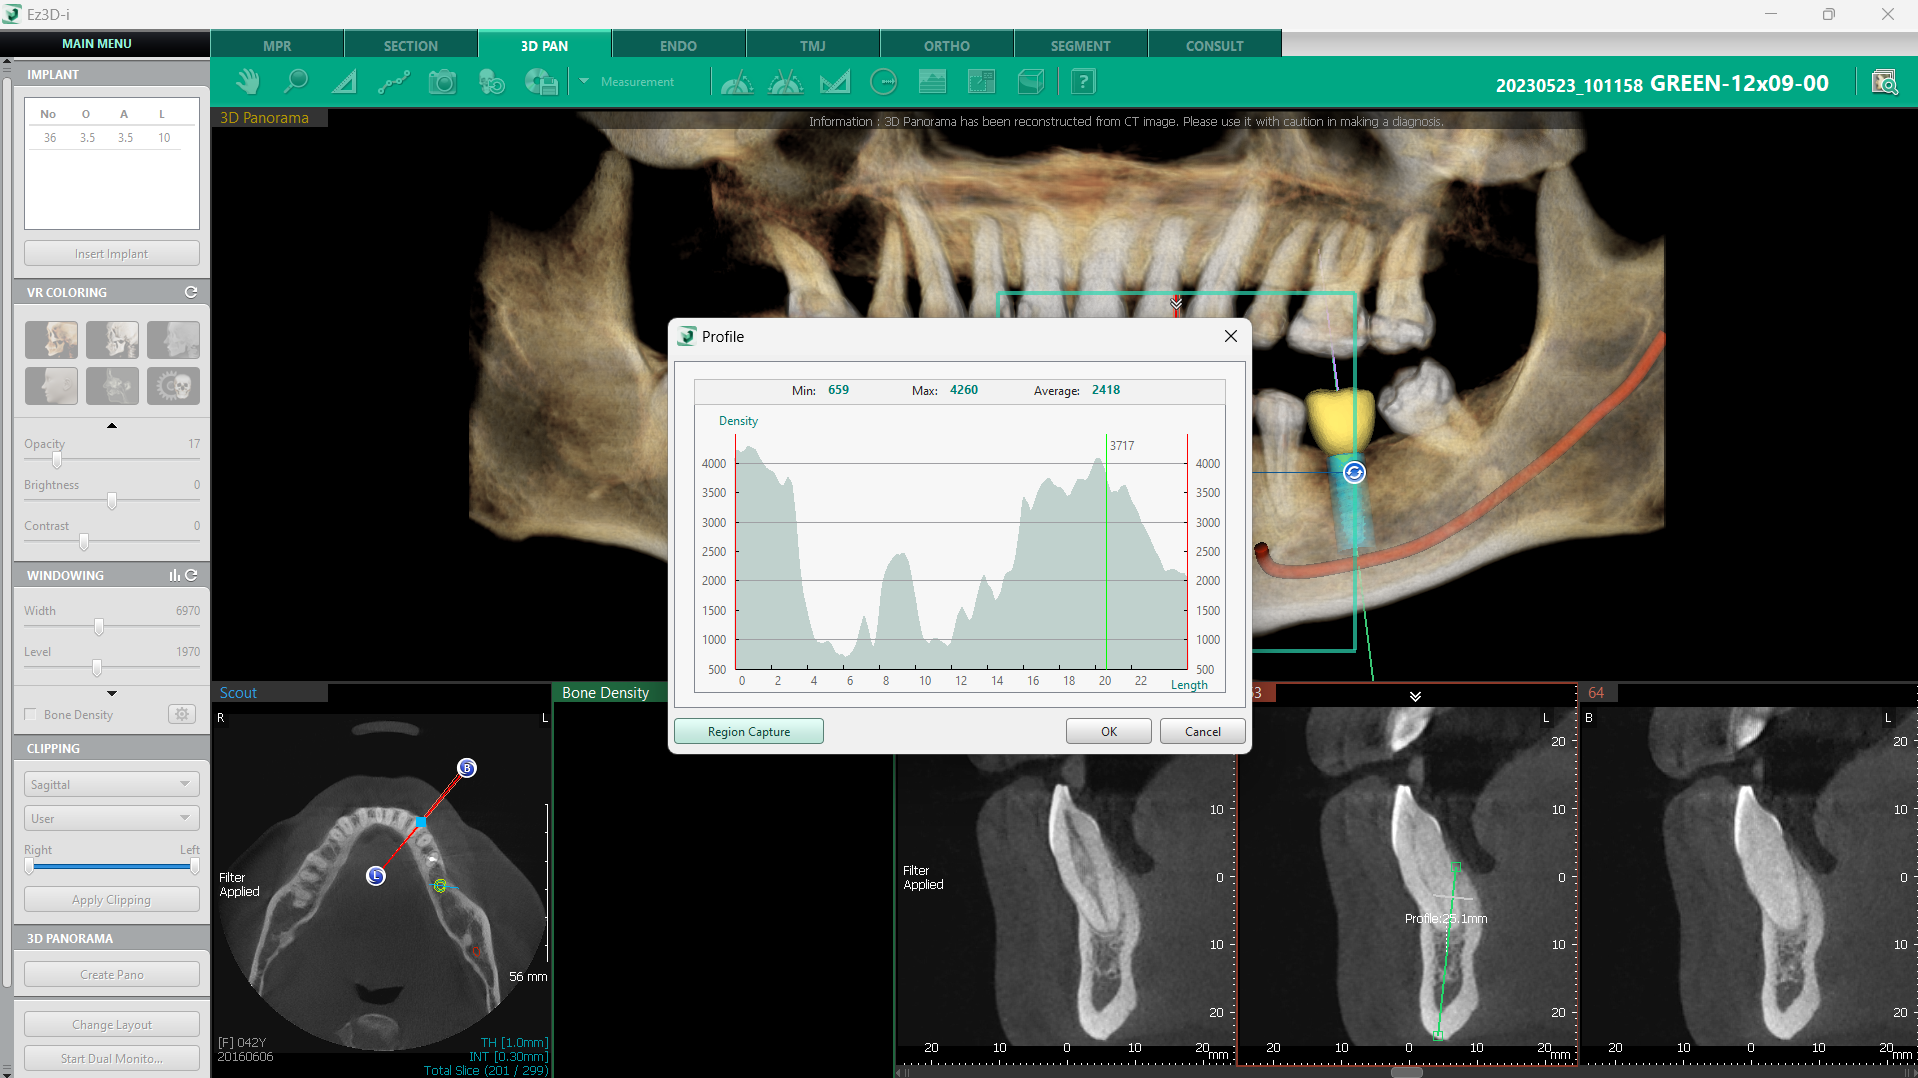
Profile
Profile is a simple and effective tool when it comes to bone density qualification. It utilizes the 3D Pan tab and the 3D Navigator. Just like we did in the case, we can use the guidelines to find the location of the future implant. By doing so, we will see the sections of that area.
Once we find the sections, it is fairly easy to click the “Profile” button at the toolbar at the top of the screen, under the menu Measurement. We need to make a line in the section image at the spot of the future implant. Once we do that, a graph overview of the bone density there will pop up. We can use the values for preliminary assessment of the situation and decide to do more examinations in case the results seem insufficient.
The patient in our case seemed to be in a good condition so the dentist continued with the preparations.
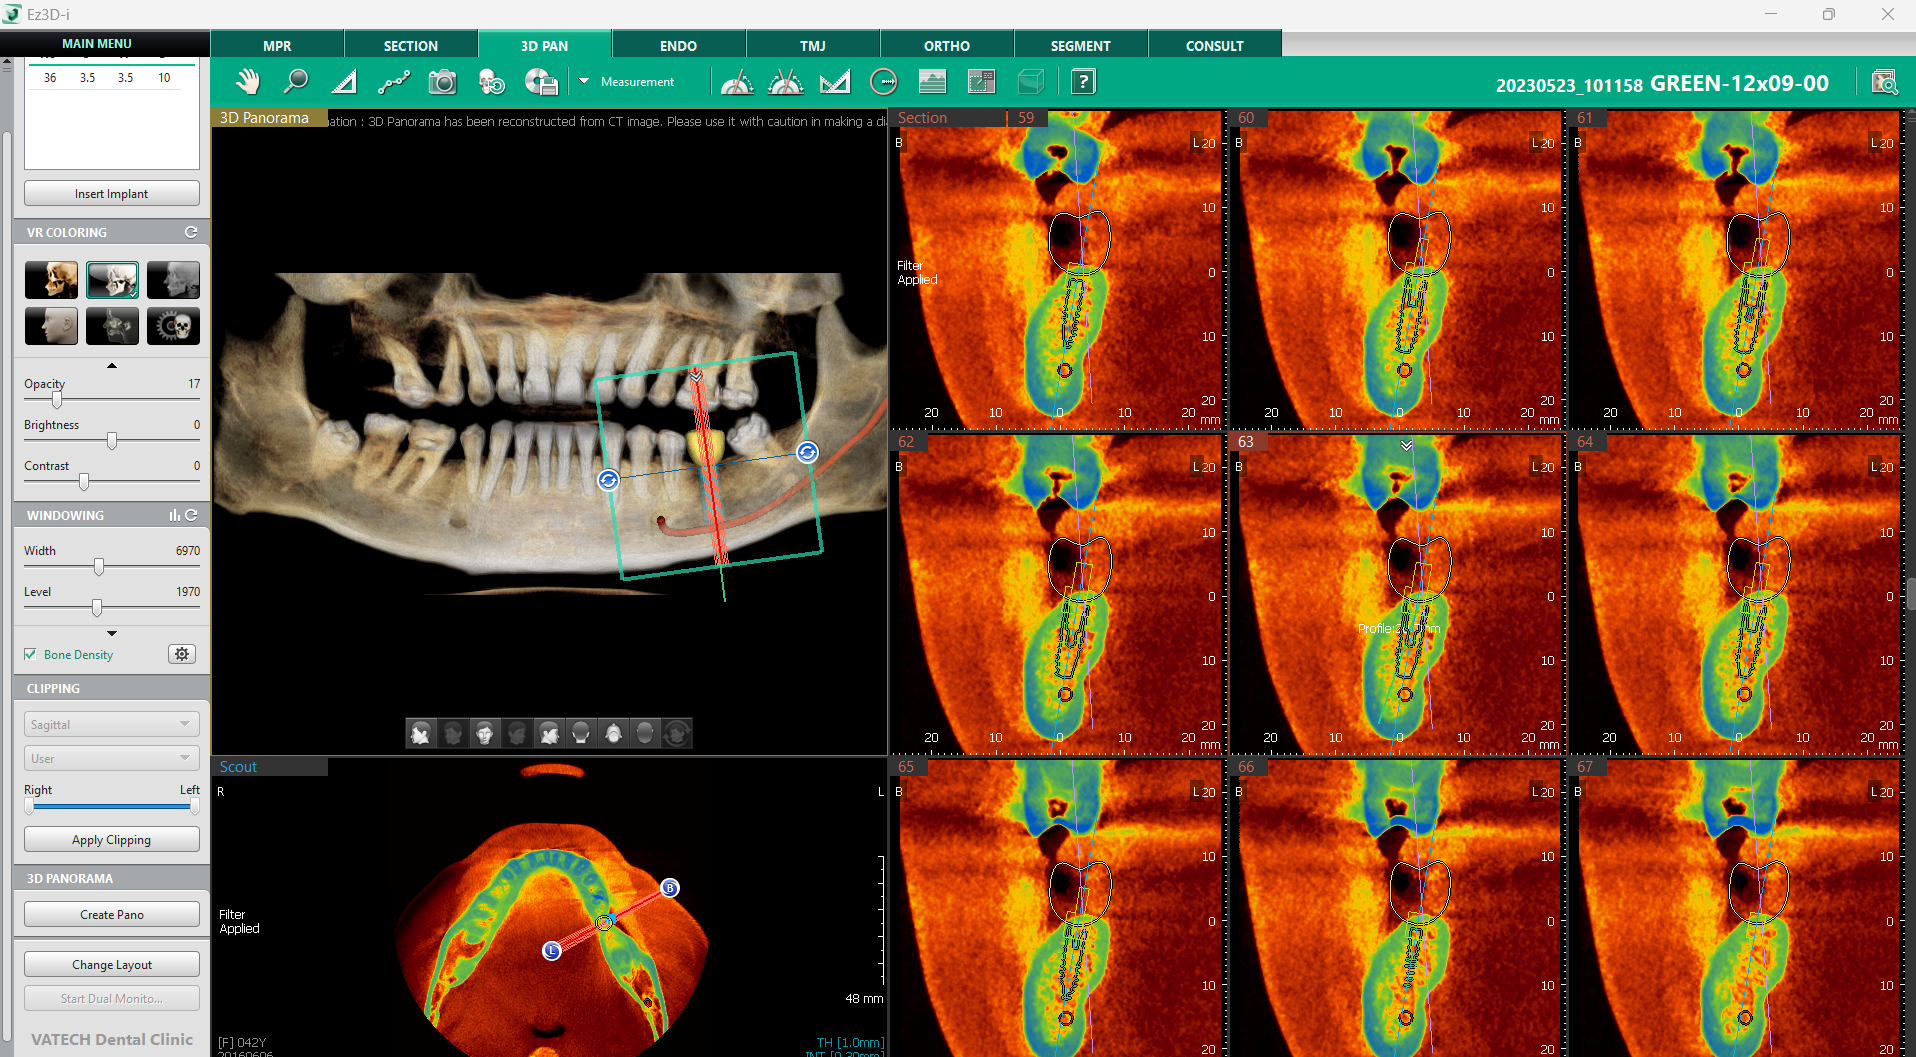
Bone Density Overlay
Bone density overlay is a handy function of the 3D PAN tab, which colors the section images based on their corresponding color on the D1 – D5 scale. It can be helpful during the diagnostic process in combination with the 3D Navigator because it offers an easy and quick overview of the situation at the spot of the future implant.
The overlay can be turned on in the Windowing section on the left side of the screen by ticking “Bone Density”.
If you need to modify the scale, you can do so by clicking on the Setting icon next to the tick-off box. In the dialog window that will pop up, you can adjust the scale by moving the green guidelines according to your needs. There is also an option to have a gradient or solid color of the bone density overlay.
For a quick and convenient way back to the original setting, there is a “Reset the setting” button at the bottom.
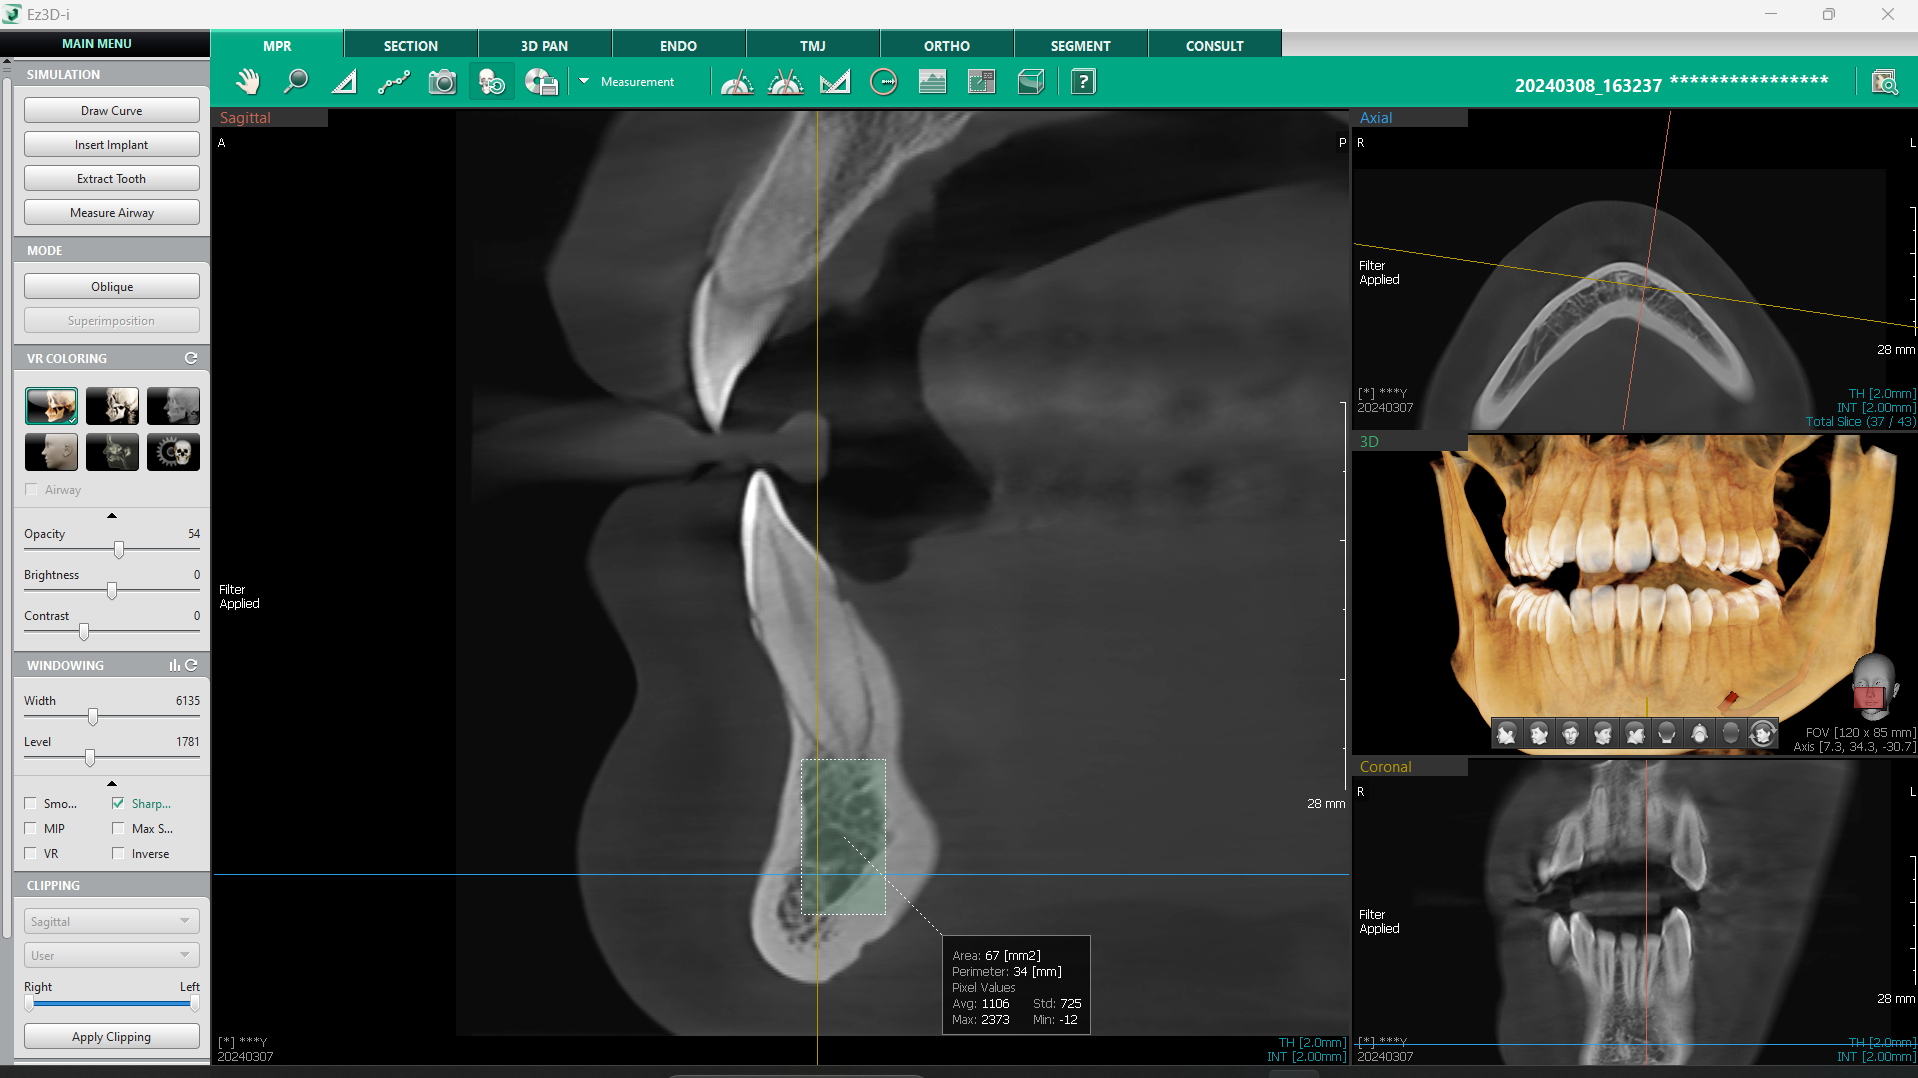
ROI
ROI, or Region of Interest, is the last tool that helps with the bone density qualification, and it is also the only tool that we will talk about today and is not from the 3D Pan tab. The function can be found in the MPR tab. The tool can measure the average bone density in a marked area.
If you want to use ROI, find the area of the bone which is of interest to your diagnosis and click on the ROI tool at the tool bar at the top of your screen. After that, mark the area of diagnosis and the tool will give you all the needed information about average bone density in the area.
The last step in the implant planning process that we used is Measurement. If you want to read more about that function, please, click HERE to read that article in which we have already covered this tool.
Here is a quick overview of how we used the functions mentioned above to do a diagnosis of the patient.
If you have any pointers or questions, please, contact us, we would love to get your professional experience on the matter of diagnosis.
For more Clinical Cases, please click here.